Following are some of the latest statistics on insolvencies in Canada.
OVERALL VOLUME OF INSOLVENCIES REMAINS STEADY
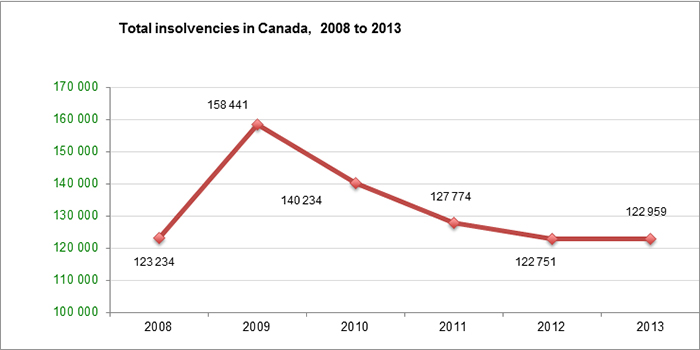
A total of 122,959 new insolvencies were filed in 2013, an increase of just 0.2 percent (208 files) over 2012.
During the economic recession and its immediate aftermath, insolvency volumes reached record highs. Volumes in 2012 and 2013 reflect a return to relative stability.

LONG DESCRIPTION FOR TABLE 1
This line graph is called Total insolvencies in Canada, 2008 to 2013.
The x-axis shows the year for the data points, starting at 2008 and continuing for each year until 2013.
The y-axis shows the number of insolvencies. Its baseline is 100,000 insolvencies and it increases by increments of 10,000 to top out at 170,000 insolvencies. The data points on the line graph are also labelled with the number of insolvencies for the respective year.
The 2008 data point indicates that there were 123,234 insolvencies, rising to 158,441 insolvencies in 2009, which is the highest number of insolvencies in the 2008–2013 period. The number of insolvencies dropped to 140,234 in 2010 and further declined to 127,774 in 2011. The number of insolvencies declined more gradually in 2012, dropping to 122,751—the lowest number of insolvencies in the period shown in the graph—before increasing slightly in 2013 to 122,959.
CONSUMER PROPOSALS AS A PROPORTION OF INSOLVENCIES CONTINUE TO GROW
There were a total of 118,678 consumer insolvencies in 2013, which accounted for 96.5 percent of all insolvencies for the year.
Total consumer insolvency volumes are now below 2009 levels. However, the ratio of bankruptcies to proposals has changed significantly over the years: in 2013, proposals represented 42 percent of all consumer insolvencies, compared with 23 percent in 2009.
In Ontario, proposals represented approximately 51 percent of all consumer insolvencies filed in 2013, a proportion that has been stable for the last three years. In other provinces, the proportion of proposals grew over this same period and currently ranges from 9 percent in Newfoundland and Labrador to 43 percent in Alberta.
NATIONAL CONSUMER INSOLVENCY RATE CONTINUES TO DROP
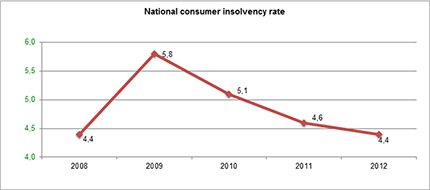
The national consumer insolvency rate dropped for the third straight year in 2012 to 4.4 (the same as the 2008 rate), after peaking at 5.8 in 2009.

LONG DESCRIPTION FOR TABLE 2
This line graph is called National consumer insolvency rate.
The x-axis shows the year for the data points, starting at 2008 and continuing for each year until 2012.
The y-axis shows the national consumer insolvency rate. Its baseline is 4.0 and it increases by increments of 0.5 to top out at 6.0. The data points on the line graph are also labelled with the national consumer insolvency rate for the respective year.
The line graph indicates that the national consumer insolvency rate was 4.4 in 2008, the lowest rate during the 2008–2012 period. In 2009, the rate jumped to 5.8, the highest level in the period shown in the graph. The rate declined fairly steadily from 2009 to 5.1 in 2010, 4.6 in 2011 and, as it was in 2008, 4.4 in 2012.
Consumer insolvency rates measure the number of consumer insolvencies per 1,000 population and can be used to compare regions with different population sizes.


